Information Disclosure Based on the TCFD Recommendations

Information Disclosure Based on the TCFD Recommendations

1. Purpose

Wacom recognizes climate change as an important consideration in striving to enhance sustainable corporate value and contribute to the realization of a sustainable society. We expressed our support for the recommendations of the Task Force on Climate-related Financial Disclosures (TCFD) on April 13, 2023. Based on the TCFD recommendations, we will promote information disclosure on governance, strategy, risk management, and metrics and targets, and continue to enrich content related to sustainability.

2. Governance

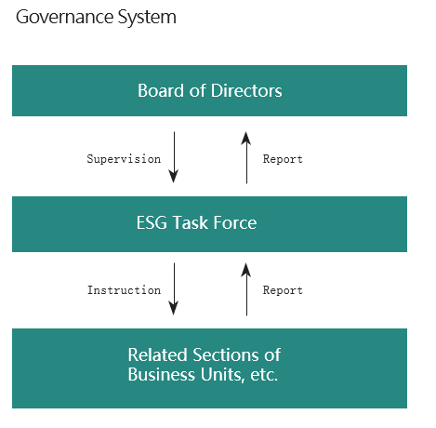
Wacom has established an ESG Task Force to ensure that the Board of Directors appropriately supervises and advises on important issues related to sustainability, such as climate change. The ESG Task Force meets regularly to examine specific sustainability policies and consider strategies, measures, and progress toward environmental targets. Participants include the President and CEO, the CFO, the environmental management representative, the secretariat of the Compliance and Risk Committee, and IR staff. Of the matters discussed by the ESG Task Force, important subjects—particularly those related to management risks and opportunities—are reported annually to the Board of Directors, which includes outside directors.


3.Strategy

Through the ESG Task Force, Wacom collects data and parameters necessary to identify and assess climate change-related risks and opportunities and analyzes the degree of business impact.
In considering and analyzing the degree of impact and potential countermeasures, we utilize scenarios published by the International Energy Agency (IEA) and the Intergovernmental Panel on Climate Change (IPCC), and analyze the impact based on two different scenarios for the year 2030.

4 ˚C Scenario 1.5 ˚C Scenario
Priority on economic activity and passive approach to climate change mitigation. Under this scenario, climate change-related government policies and regulations do not progress, resulting in a 4˚C rise in the average global temperature by the end of this century compared to the start of the industrial revolution. This will lead to further long-term changes in climate and an increased impact from extreme weather events. Society moves proactively to achieve decarbonization.
Under this scenario, policies and regulations are strengthened with the goal of achieving carbon neutrality by 2050, aiming to limit the global average temperature rise to 1.5˚C by the end of this century compared to the start of the industrial revolution. The decarbonization transition is supported by the market through ethical consumption, technological innovation, and other changes in consumer behavior.
(Reference Scenarios)
IPCC Fifth Assessment Report (AR5) RCP8.5
IEA WEO2021 STEPS
(Reference Scenarios)
IPCC Fifth Assessment Report (AR5) RCP2.6
IEA WEO2019 SDS、NZE2050


<Impact assessment in the 4˚C scenario>

The analysis of the 4˚C scenario includes anticipated impacts such as losses arising from direct damage to facilities and operational disruptions due to increased frequency of natural disasters. It also considers the increased cost of air conditioning due to rising average temperatures. The potential damage extends not only to our own facilities but also to contracted manufacturing factories, with direct impact from extreme weather events, particularly floods, being evaluated as significant risk factors.
At the same time, the intensification of extreme weather and the impact of rising temperatures could potentially lead to an increased demand for our products as web conferencing systems and similar solutions become more prevalent. Moving forward, we will enhance resilience against weather disasters through engagement with suppliers and consider response measures through continuous review of our Business Continuity Planning (BCP) measures.


<Impact assessment in the 1.5˚C scenario>

In our analysis of the 1.5˚C scenario, we anticipate the main risk being increased expenditures, including from the introduction of carbon taxes and rising electricity prices. Based on an analysis of Wacom’s business model and actual CO2 emissions, we have determined that the financial impact from these additional direct expenses is likely to be minor. However, we have to anticipate price pass-throughs of additional expenses arising from the introduction of border carbon taxes and similar impacts on contracted manufacturing and transportation partners, resulting in an increase in indirect costs. We also recognize the potential for increased demand for products which are energy-efficient and use environmentally friendly materials, and services that cater to societal and environmental concerns, such as ethical consumption. We believe that the provision of products and services which meet these needs can create business opportunities. For example, if society as a whole goes paperless, we can anticipate increased demand for various types of pen tablets across different fields, including enterprises, local governments, educational institutions, and creative industries. Wacom has been actively promoting the use of renewable energy and working towards reducing CO2 emissions. Going forward, we will continue to pursue these initiatives and consider additional measures.

Classification Item Major Risk & Opportunity
Category
Time period Assessment Countermeasure
4˚C scenario

1.5˚C scenario


Migration risks Carbon pricing ・ Increase in operating costs due to the introduction of carbon pricing including a carbon tax
Risk Long term - Small ・ Introduction of renewable energy
・ Setting CO2 emissions targets
・ Energy-saving measures such as switching to LED lighting

・ Increase in indirect costs due to the price pass-through resulting from the implementation of cross-border carbon taxes and the introduction of carbon taxes for contracted manufacturing and transportation partners. Risk Long term - Small* ・ Promotion of renewable energy at contracted partners

Changes in energy costs ・ Increase in electricity costs due to conversion to renewable energy
Risk Long term - Small ・ Energy-saving measures such as switching to LED lighting
・ Replacement with energy-saving facilities

Changes in customer behaviors

・ Increase in demand for environmental-friendly products
・ Increase in demand for various pen tablets due to paperless promotion

Opportunity Medium term - Medium* ・ Development and sales of products with high energy-saving
・  Expansion of targets to educational sites and businesses, etc.
・ Respond to customer needs for paperless

Physical risks Increase in extreme weather events ・ Direct damage to company bases due to floods or storm surges
・ Damage due to suspension of business due to damage to the base
Risk

Short Term

Large Medium ・ Strengthening resilience of stores and offices through BCP development
・ Establishment of remote work systems

・ Damage caused by floods or storm surges to contracted manufacturing partners that hold our inventories
・ Damage due to suspension of business due to damage to contracted manufacturing partners
Risk Short Term Large* Medium* ・ Evaluation of stable procurement methods
・ Grasping the BCP measures across the entire supply chain

・ Increase in remote work due to fewer opportunities to go out
Opportunity Long term Small* Small* ・ Expansion of targets to educational sites and businesses, etc.

Rise in global average temperature ・ Increase in air conditioning usage
Risk Long term Small
Small ・ Introduction of high-efficiency air conditioning systems

<Time period>
Short term: 0-1 year Medium term: 1-5 years(S)  Long term: 5-10 years

"Large", "Medium", and "Small" represent the impact evaluation outcomes. Evaluations marked with an asterisk (*) indicate qualitative results. Please note that the assessment of the impact for each event is described on an individual basis and does not take into account the interrelationships between them.

Note1: Financial impact in 2030 is calculated based on the assumption that the operating profit for 2030 is the same as that for 2021.
Note2: Physical risks (in Japan) are calculated by totaling up the estimated financial losses due to floods, storm surges, and business suspension(s).
Note3: Physical risks (outside Japan) are calculated by adding up the estimated financial losses due to floods or storm surges. Losses due to business suspension(s) are not calculated or included.

4.Risk Management

Wacom has established a Compliance Risk Committee, chaired by the Group CEO, to serve as our risk management framework. The managers of each department, including our overseas subsidiaries, are required to report to this committee in the event of realized risks or material changes in predicted risks.

The ESG Task Force identifies and evaluates risks related to climate change issues. For related risks with a significant potential impact on our company, the ESG Task Force shares information and collaborates with the Compliance Risk Committee to ensure appropriate management and supervision and minimize their potential impact on the Company. These activities are regularly reported to the Board of Directors by our Group CEO.

5.Metrics and Targets

As part of our efforts to combat to climate change, we support the Japan Climate Initiative (JCI). We have set and announced an intermediate target for CO2 emissions to be met by fiscal year 2030. We believe this intermediate target will be our share of contribution to the global goal to achieve carbon neutrality by 2050. So far, we have aimed to reduce CO2 emissions caused by our offices’ operation in Japan by 48% by 2030 compared to 2014 as the base year*1.
In April 2024, we set new targets covering our global emissions:

- Reduce Scope1 and 2 GHG emissions 80% by FY2030 compared to FY2021*2
- Reduce Scope3 GHG emissions from purchased goods and service 25% by FY2030 compared to FY2021*2

The targets were classified as in line with 1.5˚C standard of the Science Based Target (SBT), which is scientifically aligned with the target set by the Paris agreement and approved as a near-term target by the Science based Targets initiative (SBTi*3) on October 1, 2024.

*1 Following office relocation and extension completed in 2013, we set FY2014 as the base year.
*2 We newly set FY2021 as the base year when GHG scope1-2 data became available globally.
*3 The SBTi, an international initiative jointly established by the UN Global Compact (UNGC), CDP, World Resources Institute (WRI), and WWF, encourages companies to set science-based GHG reduction targets, validates, and approves those targets. https://sciencebasedtargets.org/

Electricity consumption


GHG emissions Scope1-2

•    Scope1 is calculated from the gasoline consumption of company cars and LPG consumption for the company cafeteria kitchen at the head office.
•    Scope2 is calculated from the electricity consumption of each office, the emission factor of each power company or country of the year, and the calculation method of each country.
•    The CO2 emissions in 2023 were largely reduced since we began utilizing Sai no Kuni Furusato Denki (renewable energy from post-FIT sources) at our head office in Saitama Prefecture from November 8, 2022.
•    Some medium-sized offices with several dozen staff members in Bulgaria (Sofia) and Korea (Seoul) cannot provide CO2 emissions data because of administrative rules of the buildings they lease.
•    In Germany, Dusseldorf office purchases electricity with zero emission factors, and their CO2 emissions are regarded as zero. This makes Germany’s total CO2 emissions smaller than the one of U.S., which has almost same-sized office as Germany.
•    Scope1 was recalculated by adding CO2 emissions from the gasoline consumption of company cars in overseas offices. (September 2024)

GHG emissions Scope3

Category

CO2 emissions(t-CO2)

2021 2022 2023

1. Purchased goods and services

263,951 271,626 234,466

2. Capital goods

4,919 6,764 6,157

3. Fuel-and-energy-related activities (not included in Scope 1 or 2)

208 217 231

4. Upstream transportation and distribution

2,115 1,466 1,391

5. Waste generated in operations

7* 11* 6*

6. Business travel

615 1,104 1,617

7. Employee commuting

2,008 1,850 1,430

8. Upstream leased assets

- - -

9. Downstream transportation and distribution

- - -

10. Processing of sold products

- - -

11. Use of sold products

25,476 19,094 15,000

12. End of life treatment of sold products

240 160 119

13. Downstream leased assets

- - -

14. Franchises

- - -

15. Investments

- - -

•   The result of “5. Waste generated in operations” includes data from offices in Japan only.
•   Scope3 data for 2023 was added. (September 2024)
•   Figures of Category 1,2,3,5,6,and 7 for 2021 and 2022 were corrected since there were calculation errors. (September 2024)

[back to top]

Back to top
A+ A-
Support